Lucy is an application owner in an organization. She and her team members are responsible for monitoring and maintaining the health of the application and she would like to understand the user and transaction impact of performance degradation or an outage. The performance of any application may degrade due to application issues or ultimately result in an outage, both of which can impact the end users and businesses.
She wants to gain visibility within ITSM systems on reported outages (for example, distinguish between planned and unplanned outages) and at the same time, see what was the its associated impact on browser user sessions and business transactions.
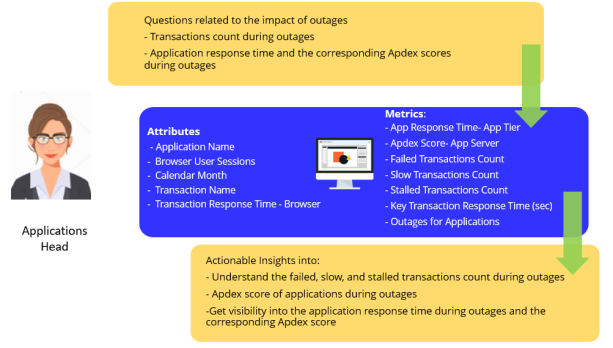
As an application owner, Lucy wants to analyze if there is a historical pattern to ITSM outages or performance degradation by applications for a calendar month and also know corresponding response time of an application during such periods. Analyzing the following provides better insights:
To get visibility into the impact of outages in applications with respect to business transactions, Apdex score, and application performance, perform the following procedures:
Prerequisites: Ensure that you have logged in using appropriate credentials.
From the top navigation panel, click  and select Existing Datasets.
In this example, Outage, Summary iCubes are selected. The selected datasets are added to the DATASETS panel.
For more information on Monitor attributes and metrics, refer the Digital.ai Intelligence Applications User Documentation.
Using the report, Lucy can get the following visibility in to the performance of applications, Apdex scores, and business services during an outage or performance degradation:
© 2022 Digital.ai Inc. All rights reserved.